Cable and Antenna Analyzer Measurement Guide : Cable and Antenna Analyzer Measurements : Setting Amplitude Parameters
 
Setting Amplitude Parameters
The amplitude menu includes settings for the vertical measurement scale. These parameters can be changed without affecting the current user calibration.
Setting the Amplitude using Top and Bottom Keys
To manually set the amplitude scale of the measurement display:
1. Select AMPLITUDE on the main menu to open the Amplitude Menu.
2. Select TOP and use the keypad to enter the top level value.
3. Select ACCEPT to apply the new power level. To exit without making a change, press CANCEL.
4. Select BOTTOM and use the keypad to enter the bottom level value.
5. Select ACCEPT to apply the new power level. To exit without making a change, press CANCEL.
Setting the Amplitude using Auto Scale
With Auto scale, the instrument will automatically set the top and bottom scales to display the current measurement.
1. Select AMPLITUDE on the main menu to open the Amplitude Menu.
2. Select AUTO SCALE.
Setting the Amplitude using Full Scale
With Full scale, the instrument will automatically set the top and bottom scales to the default values based on the measurement type.
1. Select AMPLITUDE on the main menu to open the Amplitude Menu.
2. Select FULL SCALE.
Amplitude Menu
AMPLITUDE Menu
 
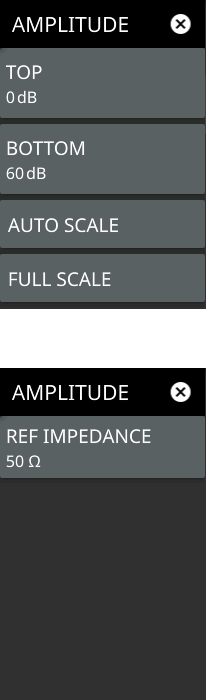
TOP
Sets the top amplitude value of the trace scale.
BOTTOM
Sets the bottom amplitude value of the trace scale.
AUTOSCALE
Automatically sets the top and bottom scales to the minimum and maximum values of the measurement with some margin on the y-axis of the display.
FULLSCALE:
Automatically sets the scale to the default setting. 0 dB to 60 dB for return loss measurements, 0 to 30 dB for cable loss, 1 to 65 for VSWR measurements, 450° to -450° for phase measurements.


When measurement results are displayed in a Smith chart, the amplitude menu consists of a single key:
REF IMPEDANCE
Indicates that the reference impedance used for Smith chart calculations is 50 Ω. The reference impedance determines the value of impedance at the center of the Smith Chart. Figure: Smith Chart Measurement illustrates a Smith Chart measurement.