Use continuous mode for measuring repetitive signals. Since this mode performs a continuous measurement, it does not differentiate between the times a pulsed or periodic signal is off, and the times it is on. If you wish to make measurements that are synchronous with a period of a waveform, consider using Pulse mode instead.
Continuous mode is the best for the following types of measurement:
• Moderate signal level (above -40 dBm for Peak sensors and -60 dBm for RMS and CW sensors).
• Signal that is CW or continuously modulated with a modulation bandwidth that is less than the VBW of the sensor in use.
• Signal modulation may be periodic, but only non-synchronous measurements are needed (overall average and peak power).
• Noise-like digitally modulated signals such as CDMA and OFDM when only average measurements are needed.
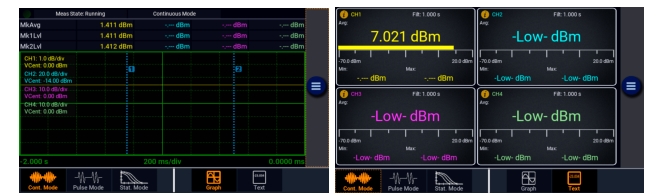
The measured result is the average/RMS power of the signal. Measurements in Continuous mode are best viewed using the Text or Graph display view.
Figure: Continuous Mode - Graph and Text shows a two-channel measurement displaying an average, minimum, and maximum power in Continuous mode. Both graph and text mode are shown in the figure below.
Continuous Mode - Graph and Text
Pulse Mode
The ML2439A provides a triggered Pulse mode for periodic or pulsed signals, analyze the power for a portion of the waveform, or a certain region of a pulse or pulse burst.
Trigger
The trigger signal can be an internal, triggered from a rising or falling edge on the measured signal, or external triggered from a rear-panel BNC input. The trigger level and polarity are both programmable, as is the trigger delay time and trigger holdoff time. Displays of both pre-trigger and post-trigger data are available, and an auto-trigger mode can be used to keep the trace running when no trigger edges are detected. Set an auto peak-to-peak trigger level setting to automatically set the trigger level based on the currently applied signal. The timebase can be set from 5 ns/div to 50 ms/div. The ML2439A graphical display has ten horizontal and eight vertical divisions. Vertical units can be set in dBm, Watts, and dB Volts. Setting vertical resolution does not affect the sensitivity of the instrument and is provided for ease of viewing.
Markers
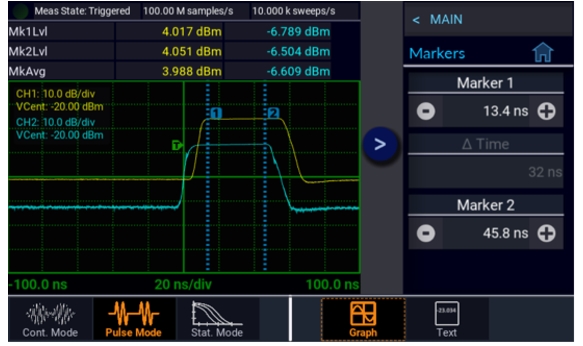
Programmable markers can be moved to any portion of the trace that is visible on the screen, and these can be used to mark regions of interest for detailed power analysis. The ML2439A can display power at each marker, as well as average, minimum, and maximum power in the region between the two markers. The power during a Time Division Multiple Access (TDMA) or Global System Mobile (GSM) burst when only the modulated portion in the center region of a timeslot is of interest. By adjusting trigger delay and other parameters, measure the power of specific timeslots within the burst. Trigger holdoff provides burst synchronization even if there is more than one edge in the burst that may satisfy the trigger level. Set the holdoff time to slightly shorter than the bursts repetition interval to guarantee that triggering occurs at the same point in the burst each sweep. Figure: Marker Measurements shows marker measurements for pulses on CH1 and CH2.
Marker Measurements
Pulse Mode Operation
Pulse mode requires a repeating signal edge that can be used as a trigger, or an external trigger pulse that is synchronized with the modulation cycle. Pulse mode performs measurements that are synchronous with the trigger (the measurements are timed or gated) so that the same portion of the waveform is measured on each successive modulation cycle. Multiple modulation cycles may be averaged together, and measurement intervals may span both before and after the trigger. Pulse mode is best for the following types of measurements:
• Moderate signal level (above about -40 dBm except when modulation is off).
• The signal is periodic.
• A time snapshot of a single event is needed (minimum single-shot time is 200 nanoseconds).
• Typical modulation and signal types: LTE, 5G, RADAR, SatCom, TCAS, Bluetooth™, Wireless LAN.
Statistical Mode
Statistical mode is available when using peak power sensors with the ML2439A. It is the best for analyzing signals with a high crest factor, that are noise-like with random or infrequent peaks, or are modulated in a random, non-periodic fashion. Statistical mode provides information about the probability of occurrence of various power levels without regard for when those power levels occurred. In the Statistical mode the instrument continuously samples the input signal and processes all of the samples to build power histograms.Many digitally modulated spread-spectrum formats use bandwidth coding techniques or many individual modulated carriers to distribute a source’s digital information over a wide bandwidth, and temporally spread the data for improved robustness against interference. When these techniques are used, it is difficult to predict when peak signal levels will occur. Analysis of millions of data points gathered during a sustained measurement of several seconds or more can yield the statistical probabilities of each signal level with a high degree of confidence. Statistical mode is best for the following types of measurements:
• Moderate signal level (above about -40 dBm except when modulation is off).
• Noise-like digitally modulated signals such as CDMA (and all its extensions) or OFDM when probability information is helpful in analyzing the signal.
• Any signal with random, infrequent peaks, when you need to know the peak-to-average ratio or Crest Factor and just how infrequent those peaks are.
Complementary Cumulative Distribution Function
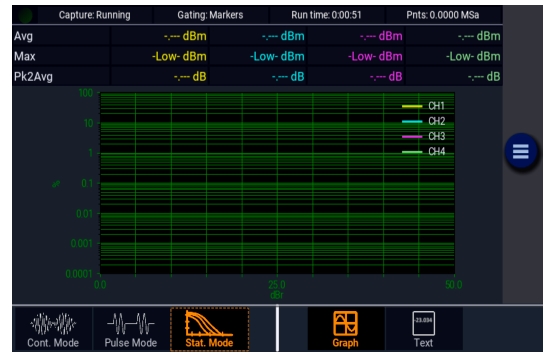
The statistical analysis of the current sample population is displayed using a normalized Complementary Cumulative Distribution Function (CCDF) presentation shown in Figure: CCDF Plot. The CCDF is the probability of occurrence of a range of peak-to-average power ratios on a log-log scale. CCDF is non-increasing in y-axis and the maximum power sample lies at 0%. A cursor provides measurement of power or percentage at a user-defined point on the CCDF. As with all other graphical displays, the trace can be easily scaled and zoomed, or the statistical data may be presented as a table in Text Display mode.
CCDF Plot
The CCDF has become a useful tool for analyzing communication signals that have a Gaussian-like distribution (CDMA, OFDM) where signal compression can be observed at rarely occurring peaks. It is most often presented graphically using a log-log format where the x-axis represents the relative offset in dB from the average power level and the log-scaled y-axis is the percent probability that power will exceed the x-axis value.
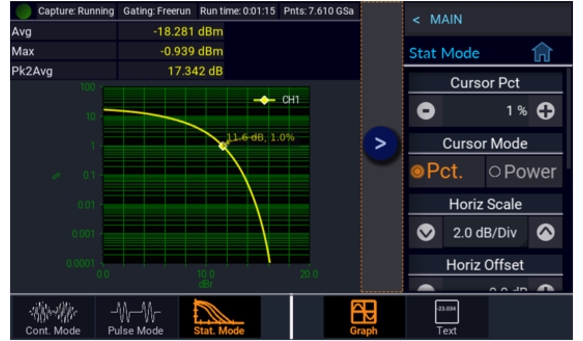
In a non-statistical peak power measurement, the peak-to-average ratio is the parameter that describes the headroom required in linear amplifiers to prevent clipping or compressing the modulated carrier. The meaning of this ratio is easy to visualize in the case of simple modulation in which there is close correspondence between the modulating waveform and the carrier envelope. When this correspondence is not present, the peak-to-average ratio alone does not provide adequate information. It is necessary to know what fraction of time the power is above (or below) particular levels. For example, some digital modulation schemes produce narrow and relatively infrequent power peaks that can be compressed with minimal effect. The peak-to-average ratio alone would not reveal anything about the fractional time occurrence of the peaks, but the CCDF clearly shows this information. In Figure: CCDF Analyzed, assume a full length run of one hour plus has been made and the CCDF is analyzed. At 0% is the maximum peak power that occurred during the entire run. At 1% is the power level that was exceeded only 1% of the time during the entire run.
CCDF Analyzed
Note that this analysis does not depend upon any particular test signal, or upon synchronization with the modulating signal. In fact, the analysis can be done using actual communication system signals. Normal operation is not disturbed by the need to inject special test signals. This type of analysis is particularly suited to the situation in which the bit error rate (BER) or some other error rate measure is correlated with the percentage of time that the signal is corrupted. If known short intervals of clipping are tolerable, the CCDF can be used to determine optimum transmitter power output. The CCDF is also used to evaluate various modulation schemes to determine the demands that will be made on linear amplifiers and transmitters and the sensitivity to non-linear behavior.