ML2439A USB Power Meter User Guide : Making Measurements : Main Menu
 
Main Menu
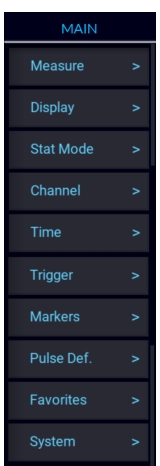
The ML2439A Main Menu is shown in Figure: Main Menu. Each menu function is described below.
Main Menu
Measure
Display
Stat Mode
See Stat Mode Menu. Only available if the statistical mode in the front display is selected. Refer to Typical Power-On Display.
Channel
Time
Trigger
Markers
Pulse Def.
Favorites
This function is not implemented at this time.
System
 
Measure Menu
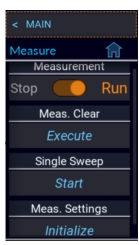
The Measure menu is described in Figure: Measure Menu.
Measure Menu
Measurement
The state of the data acquisition mode for taking measurements. If Measurement is set to Run, the ML2439A immediately begins taking measurements (Continuous and Statistical modes), or arms its trigger and takes a measurement each time a trigger occurs (Pulse Mode). If set to Stop, the measurement will begin (or be armed) if Start is selected under the Single Sweep setting (Pulse Mode Only), and will stop once the measurement criteria (averaging) has been satisfied.
Meas. Clear
Selecting Execute clears display traces, data buffers, and clears averaging filters to empty. In Statistical Measure mode, the menu item is replaced with Stat Capture and selecting Reset clears the acquired sample population.
Single Sweep
Only available in Pulse mode. Select to start a single measurement cycle in Pulse mode when Measurement is set to Stop. Enough trace sweeps must be triggered to satisfy the channel averaging setting.
Meas. Settings
This will load the default operating parameters listed in Table 3-3 into the meter. Only the settings shown in the table are affected and all others remain in their current state.
Display Menu
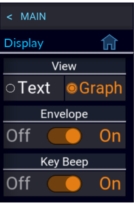
The Display menu is described in Figure: Display Menu.
Display Menu
View
Selecting Text displays a table of measurements for the current measurement mode. In Continuous mode, selecting Text displays the enabled channel power as shown in Figure: Continuous Mode - Graph and Text. Selecting Graph displays the trace graphical view.
Envelope
Enables or disables the Envelope display mode. In Pulse and Modulated modes, the Envelope display is used to highlight the range of signal excursions. When Envelope display mode is On, the trace is drawn as a wide line, which is filled in between the minimum and maximum power readings. A series of vertical pixels, representing the range of signal excursions or "envelope" of the signal will be illuminated for each horizontal trace pixel. Envelope display is only available for Peak Power sensors.
Key Beep
Enables and disables the audible key beep.
 
Stat Mode Menu
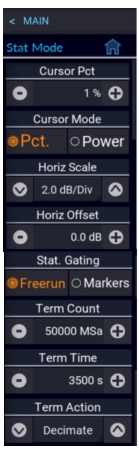
The Statistical Mode menu is described in Figure: Statistical Mode Menu. Note that this menu is only available when Stat. Mode is selected.
Statistical Mode Menu
 
Cursor Pct
Sets the CCDF cursor to the desired probability. When Cursor mode is set to Power, the menu item changes to Cur Pow Ref and sets the desired power.
Cursor Mode
Select the independent variable for the CCDF cursor. If Percent is selected, relative power at the cursor's intersection with the CCDF curve will be measured. If Power is selected, probability at the cursor's intersection with the CCDF curve will be measured.
Horiz Scale
Select the horizontal scale for the statistical graphic display.
Horiz Offset
Select the horizontal offset for statistical graphic display.
Stat. Gating
Selects Freerun or Marker gating for statistical acquisition. If Freerun is selected, then all the samples are acquired without regard to sweep acquisition. If Markers are selected, then only samples within the time marker interval on the Pulse mode triggered sweep will be included in the statistical sample population.
Term Count
Sets the terminal sample count for the CCDF acquisition.
Term Time
Sets the terminal running time for the CCDF acquisition.
Term Action
Select the action to take when either the terminal count is reached or terminal time has elapsed. Selecting Decimate will divide all sample bins by 2 and continue. The total sample count will be halved each time a decimation occurs. Selecting Restart clears the statistical sample population and starts a new one. Selecting Stop will stop accumulating samples and hold the result.
• Decimate: Divide all sample bins by 2 and continue.
Channel Menu
The Channel menu is described in Figure: Channel Menu.
Channel Menu
 
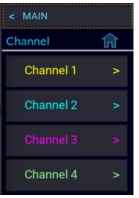
Channel 1 - 4
Opens the Channel menu for the selected channel. Each Channel function provides the same menu and is described below.
 
 
Channel 1 Submenu
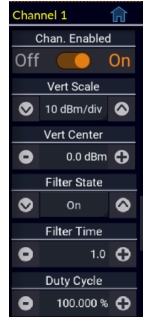
An individual Channel 1 submenu is described in Figure: Channel 1 Submenu.
Channel 1 Submenu
 
 
Chan. Enabled
Toggles display of the trace and measurements for the channel. The channel may still be used as a trigger source when set to Off.
Vert Scale
Set the power or voltage vertical axis level for the trace display based on the units as shown below.
dBm: 0.1, 0.2, 0.5 1, 2, 5, 10, 20, 50 dB/div
Watts: 1pW to 500 MW/div in a 1-2-5 progression
Volts: 1µV to 100 kV/ div in a 1-2-5 progression
Vert Center
Set the power or voltage level of the horizontal centerline of the graph for the specified channel in the selected channel units.
Filter State
Available in Continuous mode only. Set the current value of the integration filter on the selected channel. The filter can be set to Off, On, or Auto. Off, provides no filtering, and can be used at high signal levels when absolute minimum settling time is required. On, provides a user-specified integration time to be entered for use. Auto, uses a variable amount of filtering, which is set automatically by the power meter based on the current signal level to a value that gives a good compromise between measurement noise and settling time at most levels.
Filter Time
Available in Continuous mode only. Sets the length of the integration filter. The filter is a “sliding window” which averages samples taken within a time window whose duration is set by this field. All samples within the time window are equally weighted.
Duty Cycle
Available in Continuous mode only. Sets the duty cycle in percent for calculated CW pulse power measurements. Setting the duty cycle to 100% is equivalent to a CW measurement.


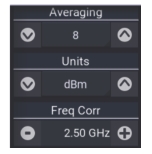
Averaging
Units Scale
Only available in Pulse and Statistical modes. Set the number of traces averaged together to form the measurement result on the selected channel. Averaging can be used to reduce display noise on both the visible trace, and on marker and automatic pulse measurements. Trace averaging is a continuous process in which the measurement points from each sweep are weighted (multiplied) by an appropriate factor and averaged into the existing trace data points. In this way, the most recent data will always have the greatest effect on the trace waveform, and older measurements will be decayed at a rate determined by the averaging setting and trigger rate. This averaging technique is often referred to as “exponential” averaging because averaging imposes a first-order Infinite Impulse Response (IIR) exponential filter with a time constant of "n" where n is the Average (number of averages) setting.
Note: For timebase settings of 200 ns/div and faster, the MA244xxA Series power sensors acquire samples using a technique called equivalent time or random interleaved sampling (RIS). In this mode, not every pixel on the trace gets updated on each sweep, and the total number of sweeps needed to satisfy the average setting will be increased by the sample interleave ratio of that particular timebase. At all times the average trace is the average of all samples for each pixel, and the min/max are the lowest and highest of that same block of samples for each pixel.
Units
Select the channel units. The trace may be shown in units of dBm, Watts, or Volts. The Units selection determines the range of the scale values and also affects displayed text and measurement values.
Freq. Corr
Sets measurement frequency for the RF signal that is applied to the sensor for the current measurement. The appropriate frequency calibration factor from the sensor’s calibration table will be interpolated and applied automatically. Application of this calibration factor compensates for the effect of variations in the flatness of the sensor’s frequency response.
 
Note: The power sensor has no way to determine the carrier frequency of the applied signal, so the user must always enter the frequency.
 
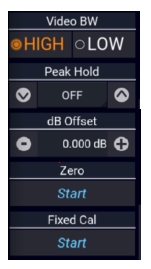
Video BW
Sets the sensor video bandwidth for the channel. HIGH is appropriate for most measurements, and the actual bandwidth depends upon the sensor model. LOW bandwidth offers additional noise reduction for CW or signals with very low modulation bandwidth. If LOW bandwidth is used on signals with fast modulation, measurement errors may result if the sensor cannot track the fast-changing envelope of the signal.
dB Offset
Sets a measurement offset in dB for the selected channel. This is used to compensate for external couplers, attenuators, or amplifiers in the RF signal path ahead of the power sensor.
Zero
Performs a zero offset null adjustment. The sensor does not need to be connected to any calibrator for zeroing. This action removes the effect of small, residual power offsets, and should be performed prior to low-level measurements. The procedure is often performed in-system. There should be no RF signal applied to the sensor input prior to zeroing.
Fixed Cal
Performs a single point sensor gain calibration of the selected channel at 0 dBm and the current frequency setting. This requires a calibrated 0 dBm (1.00 mW) signal source at the current measurement frequency. This procedure calibrates the sensor’s gain at a single point. At other levels, that gain setting is combined with stored linearity factors to compute the actual power.
Time Menu
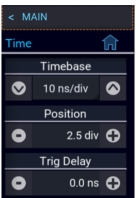
The Time menu is described in Figure: Time Menu.
Time Menu
 
Timebase
Controls the timebase or horizontal scale of the acquisition and is noted on the horizontal axis label of the Trace View. The Timebase pulldown menu permits selection of fixed timebase ranges from 5 ns/div to 50 ms/div (sensor series dependent) in a 1-2-5 progression.
Position
Sets the location of the trigger point on the acquired trace waveform. The Trig Delay setting is in addition to this setting, and will cause the trigger position to appear in a different location.
Trig Delay
The trigger delay time is set in seconds with respect to the trigger. Positive values mean that the trace display shows a time interval after the trigger event. This positions the trigger event to the left of the trigger point on the display, and is useful for viewing events during a pulse, or some fixed delay time after the rising edge trigger. Negative trigger delay mean that the trace display shows a time interval before the trigger event, and is useful for looking at events preceding the trigger edge.
Trigger Menu
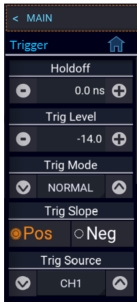
The Trigger menu function is described in Figure: Trigger Menu.
Trigger Menu
Trigger Holdoff
Set the trigger holdoff time. Trigger holdoff is used to disable the trigger for a specified amount of time after each trigger event. The holdoff time starts immediately after each valid trigger edge and will not permit any new triggers until the time has expired. When the holdoff time is up, the trigger re-arms, and the next valid trigger event (edge) will cause a new sweep. This feature is used to help synchronize the power meter with burst waveforms such as a TDMA or GSM frame. The trigger holdoff resolution is 0.01 microseconds, and it should be set to a time that is longer than the burst duration but shorter than the frame repetition interval
Trigger Level
Sets the threshold level for the trigger signal used in the Auto and Normal trigger modes. The trigger level can be entered numerically or changed by using arrow keys. The trigger level range has a range that is sensor model dependent
(see the sensor specifications for your specific sensor model).
The trigger range is automatically adjusted to include the dB Offset parameter set for the source channel. For example, if the trigger level = 10 dBm and the dB Offset is changed from 0 to 20 dB, then the offset-adjusted trigger level will be displayed to the user as 30 dBm. Likewise, the maximum trigger level range will be extended to 40 dBm. The trigger level set point and setting range are both shifted upward by 20 dB.
Trigger Mode
Set the trigger mode for synchronizing data acquisition with pulsed signals. Normal mode will cause a sweep to be triggered each time the power level crosses the preset trigger level in the direction specified by the trigger slope setting. If there are no edges that cross this level, no data acquisition will occur. Auto mode operates in much the same way as Normal mode but will automatically generate a trace if no trigger edges are detected for a period of time (100 to 500 milliseconds, depending upon timebase). This will keep the trace updating even if the pulse edges stop. The Auto PK-PK mode operates the same as Auto mode but will adjust the trigger level to halfway between the highest and lowest power or voltage levels detected. This aids in maintaining synchronization with a pulse signal of varying level. The Freerun mode forces unsynchronized traces at a high rate to assist in locating the signal.
Trigger Source
Set the trigger source used for synchronizing data acquisition. The CH # settings use the signal from the associated sensor. Ext setting uses the signal applied to the rear panel TRIG IN connector.
The trigger source can be any of the resource channels (CH1, CH2, etc.), or the Ext (external) trigger input signal. The IND (independent) trigger setting provides each connected sensor to trigger independently from its own RF input.
The external trigger is attached to the Trig In BNC connector on the rear of the ML2439A Power Meter and requires a TTL signal level, minimum pulse width of 10 ns, and maximum frequency of 50 MHz.
Trigger Slope
Set the trigger slope or polarity. When set to +, trigger events will be generated when a signal’s rising edge crosses the trigger level threshold. When – is selected, trigger events are generated on the falling edge of the pulse.
Markers Menu
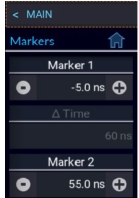
The Markers menu is described in Figure: Markers Menu.
Markers Menu
Marker #
Set the time position of marker 1 or 2 relative to the trigger. Note that time markers must be positioned within the time limits of the trace window in the graph display. If a time outside of the display limits is entered, the marker will be placed at the first or last time position as appropriate.
Time
Displays the result of Marker 2 - 1 in seconds. This item is read only.
Pulse Def. Menu
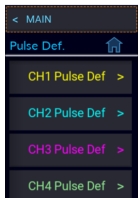
The Pulse Definition menu is described in Figure: Pulse Definition Menu.
Pulse Definition Menu
Pulse Def.
Opens the Pulse Definition menu for the selected channel. Each of the Channels 1 through 4 provide the same functions and are described below.
 
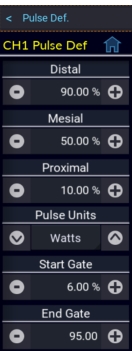
CH1 Pulse Def Submenu
The Channel 1 Pulse Definition (CH1 Pulse Def) submenu is described in Figure: Channel 1 Pulse Definition Submenu.
Channel 1 Pulse Definition Submenu
Distal
Sets the pulse amplitude percentage that defines the end of a rising edge or beginning of a falling edge transition. Typically, this is 90% voltage or 81% power relative to the top level of the pulse. This setting is used when making automatic pulse rise-time and fall-time calculations.
Mesial
Sets the pulse amplitude percentage that defines the midpoint of a rising or falling edge transition. Typically, this is 50% voltage or 25% power relative to the top level of the pulse. This setting is used when making automatic pulse width and duty cycle calculations.
Proximal
Sets the pulse amplitude percentage that defines the beginning of a rising edge or end of a falling edge transition. Typically, this is 10% voltage or 1% power relative to the top level of the pulse. This setting is used when making automatic pulse rise-time and fall-time calculations.
Pulse Units
Controls whether the distal, mesial, and proximal thresholds are computed as voltage or power percentages of the top/bottom amplitudes. If Volts is selected, the pulse transition thresholds are computed as voltage percentages, and if Watts, they are computed as power percentages.
Many pulse measurements call for 10% to 90% voltage (which equates to 1% to 81% power) for rise-time and fall-time measurements, and measure pulse widths from the half-power (–3 dB, 50% power, or 71% voltage) points. The Pulse Units setting is independent of the channel’s display units setting.
Start Gate
Sets the beginning of the pulse measurement region as a percentage of the pulse width. The Start Gate has a continuous range of 0.0% to 40.0% of the pulse width and may be entered numerically or varied using the up or down arrows.
End Gate
Sets the end of the pulse measurement region as a percentage of the pulse width. The End Gate has a continuous range of 60.0% to 100.0% of the pulse width and may be entered numerically or varied using the up or down arrows. The Gate settings define the measurement interval for the following power related pulse measurements: Pulse Average, Pulse Peak, Pulse Minimum, and Pulse Droop/Tilt. Pulse timing measurements between mesial crossings such as width and period are not affected. The purpose of the Pulse Gate setting is to exclude edge transition effects from the pulse power measurements.
System Menu
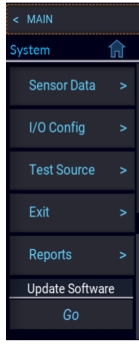
The System menu is described in Figure: System Menu.
System Menu
System
The System menu displays the available system-level features. Each menu is described below.
Sensor Data
I/O Config
Test Source
Exit
See Exit
Reports
See Reports.
Update Software
Sensor Data
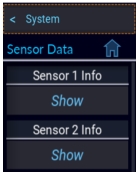
The Sensor Data submenu is described in Figure: Sensor Data Menu
Sensor Data Menu
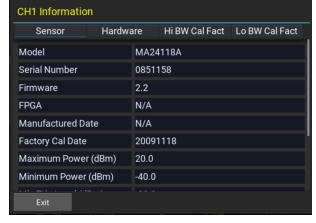
Sensor Data
Provides information about the selected sensor in a pop-up dialog as shown below.
I/O Config
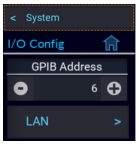
The I/O Config submenu is described in Figure: I/O Config Menu
I/O Config Menu
 
GPIB Adress
Set the GPIB address in use for instruments equipped with GPIB option.


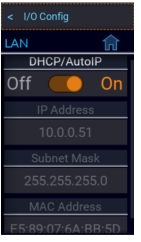
LAN
Set up LAN configuration.
• DHCP/AutoIP: If DHCP/AutoIP is enabled (On), the instrument will attempt to obtain its IP Address and Subnet Mask, a DHCP (dynamic host configuration protocol) server on the network. If no DHCP server is found, the instrument will select its own IP Sets the end of the pulse measurement region as a percentage of the pulse width. The End Gate has a continuous range of 60.0% to 100.0% of the pulse width and may be entered numerically or varied using the up or down arrows. The Gate settings define the measurement interval for the following power related pulse measurements: Pulse Average, Pulse Peak, Pulse Minimum, and Pulse Droop/Tilt. Pulse timing measurements between mesial crossings such as width and period are not affected. The purpose of the Pulse Gate setting is to exclude edge transition effects from the pulse power measurements. If DHCP/AutoIP is disabled (Off), the instrument will use the IP Address and Subnet Mask values that have been set by the user.
• IP Address: Set the Internet Protocol (IP) address of the Ethernet adapter. If DHCP/AutoIP mode is enabled, this menu is read-only.
• Subnet Mask: Set the subnet mask for the Ethernet adapter. If DHCP/AutoIP mode is enabled, this menu is read-only.
• MAC Address: Displays the mask for the Ethernet adapter. If DHCP/AutoIP mode is enabled, this menu is read-only MAC address for the Ethernet adapter. This menu item is read-only.
Test Source
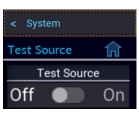
The Test Source submenu is described in Figure: Test Source Submenu
Test Source Submenu
Test Source
Enable or Disable output of the built-in 0 dBm 50 MHz test source.
 
Exit
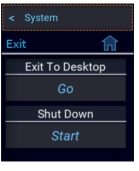
The Exit submenu is described in Figure: Exit Submenu
Exit Submenu
Exit
Select Go to exit the ML2439A Power Meter main application and view the OS desktop.
 
Shut Down
Shuts down power to the ML2439A putting the meter in standby mode and is the same as pressing the ON/Standby button on the front panel.
 
Reports
The Reports submenu is described in Figure: Reports Submenu
Reports Submenu
Reports
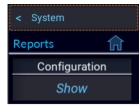
Select Show to display the About dialog with configuration information for the ML2439A Power Meter as shown in Figure: About Screen.
Update Software
The Reports submenu is described in Figure: Update Software Submenu
Update Software Submenu
Update Software
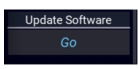
Select Go to search the connected USB drive for the *.tar software update file and update or re-install the version found.