Two measurement display modes are available: spectrum and spectrogram. Figure: OBSAI Spectrum Display and Figure: OBSAI Spectrogram Display show display screens on an Anritsu BTS Master MT8220T loaded with Option 753. The screens and menus on your instrument may differ depending on the model, installed option, and firmware version.
In both display modes, the connection status of the SFP port or ports is displayed on the instrument screen as colored dots above the sweep window. Green indicates a good connection, red indicates an error, and gray (no color) means no connection. The examples below illustrate a dual-SFP instrument screen, with no connection at SFP Port 2.
• LOS – Loss of Signal
• LOF – Loss of Frame
OBSAI Spectrum
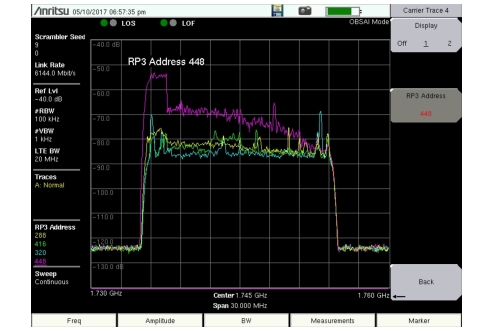
Spectrum mode displays signals as a waveform in a traditional spectrum analyzer view.
OBSAI Spectrum Display
• Scrambler Seed – Is the scrambling seed of the OBSAI link when the link rate is 6144.0 Mbps (8x). “NA” is displayed when the link rate is not 6144.0 Mbps.
• Link Rate – Is the selected link rate, which applies to both SFPs on dual SFP models.
• Ref Lvl – Indicates the maximum amplitude value on the Y-axis, that is, the top grid line, of the sweep window. Refer to Amplitude Menu. The value shown is the amplitude reference level of the currently active display: Display 1 or Display 2.
• RBW – Is the current resolution bandwidth. When present, a pound sign (#) in front of RBW indicates that the Auto RBW setting is off and the RBW value is or can be set independently of the frequency span. Refer to Bandwidth Menu.
• VBW – Is the current video bandwidth. When present, a pound sign (#) in front of VBW indicates that the Auto VBW setting is off and the VBW value is or can be set independently of RBW.
• LTE BW – Shows the LTE bandwidth of the currently active display. Refer to Display Config Menu.
• Traces – Displays the Trace A, B, and C Operations settings associated with Trace 1. Refer to Trace Menu. These settings are not displayed when Trace 1 is turned off.
• RP3 Address – Displays the RP3 address associated with each of the four potential carrier traces. The decimal address values are displayed in the same color as their respective traces. The values are blank for traces that are turned off.
• Sweep – Shows the current sweep mode, single or continuous. Refer to Sweep Menu.
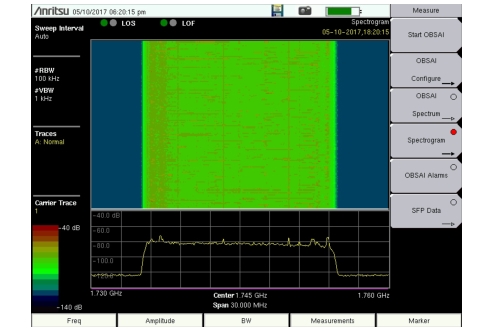
Spectrogram
A spectrogram is a three-dimensional representation of frequency, time, and power. Color is used to represent the relative power levels. In this view, only one trace is displayed at a time (one on each display in dual display mode).
OBSAI Spectrogram Display
• Sweep Interval – Shows the sweep interval of the currently active trace. Refer to Spectrogram Menu.
• RBW – Is the current resolution bandwidth. When present, a pound sign (#) in front of RBW indicates that the Auto RBW setting is off and the RBW value is or can be set independently of the frequency span. Refer to Bandwidth Menu.
• VBW – Is the current video bandwidth. When present, a pound sign (#) in front of VBW indicates that the Auto VBW setting is off and the VBW value is or can be set independently of RBW.
• Traces – Displays the Trace A, B, and C Operations settings associated with Trace 1. Refer to Trace Menu. These settings are not displayed when Trace 1 is turned off.
• Carrier Trace – Shows the number of the trace being displayed, N/A if no carrier trace is configured, that is, turned on. In dual display mode, a value is displayed for each of Spectrogram Display 1 and 2. When switching from dual to single mode, the currently active display will be shown as the single display. Refer to Display Setup Menu.