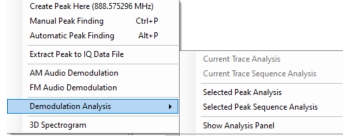
The trace density analysis tools provide peak search, AM/FM, demodulation analysis, and 3D tools.
Create Peak Here
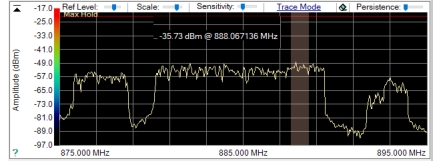
Click a desired peak in the density plot. The mouse readout of the navigation is shown. Click Create Peak Here from the Analysis tools shown in Figure: Density Plot Analysis Tools. The peak will appear as shown in Figure: Create Peak.
Create Peak
Manual Peak Finding
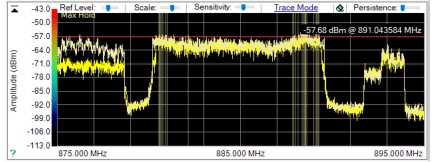
Manually move the red horizontal power reference line to set the signal peak power level threshold. Click to show the peaks as shown in Figure: Manual Peak Detection
Manual Peak Detection
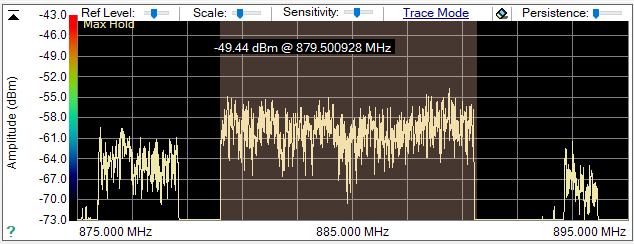
Automatic Peak Finding
The automatic peak finding tool is dependent on the control panel slider settings. Click Automatic Peak Finding detects and displays the peak signals as shown in Figure: Automatic Peak Detection.
Click to view the Trace Density plot as a 3D Spectrogram.
Peak Finder Example
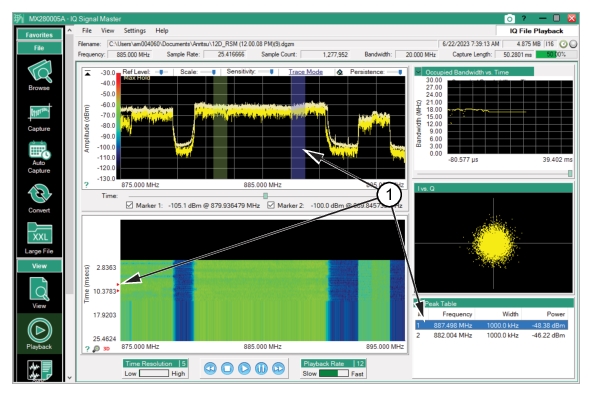
Use the density plot analysis menu shown in Figure: Density Plot Analysis Tools. Use the mouse readout to determine a peak of interest and click Create Peak Here. Multiple peaks can be clicked and analyzed. Each click will display a peak on the density plot and provide details of the peak in the Peak Table. A red marker identifying the location of the peak is also displayed in the spectrogram as shown in Figure: Peak Finder Example.
Peak Finder Example
1. Peak Display
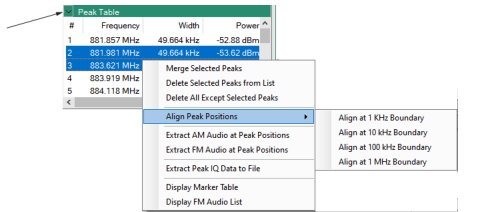
Peak Table Menu
Click the corner chevron icon to display the Peak Table menu commands shown in Figure: Peak Table Menu.
Peak Table Menu
Merge Selected Peaks
Shift-click the markers in the Peak Table to display as merged in the trace/Density display plot. Note the markers to merge must be in synchronous order. (i.e 1-2) (2-3) (1,2,3).
Delete Selected Peaks From List
Click the markers to delete from the Peak table and from the trace/density plot.
Delete All Except Selected Peaks
Deletes all markers except the selected peaks in the marker window.
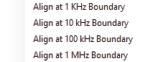
Align Peak Positions
Provides the Boundary Menu shown below:
Extract AM Audio at Peak Positions
Extracts the identified AM Audio peak signals in the trace/density plot. The table changes to AM Audio and displays the signal markers frequency and power in the table. Right-click the AM audio table to display the menu shown below. FM Audio displays the same menu.
Extract FM Audio at Peak Positions
Extracts the identified FM Audio peak signals in the trace/density plot. The table changes to FM Audio and displays the signal markers frequency and power in the table. Right-click the FM audio table to display the menu shown below.
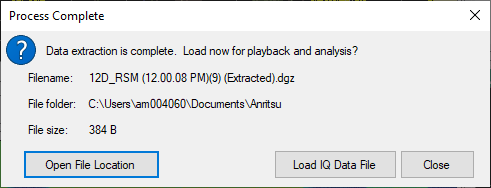
Click a detected peak in the Peak Table and then click Extract Peak IQ Data to File. The dialog appears below.
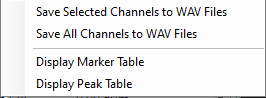
Display Marker Table:
For quick access, the Audio table changes to the Marker Table. SeeMarker Table.
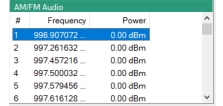
Display FM Audio List
Displays the Frequency and Power parameters of the peak frequencies as shown below.
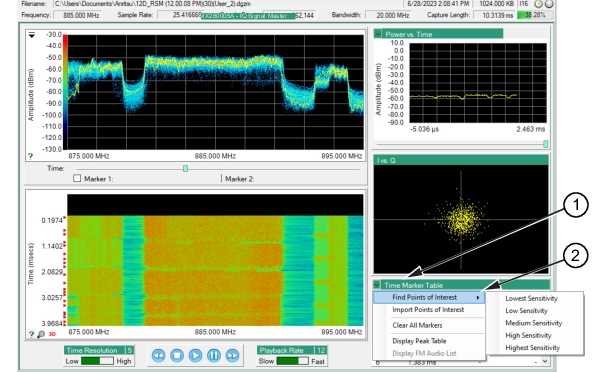
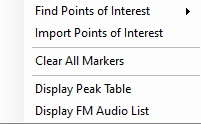
Time Marker Table
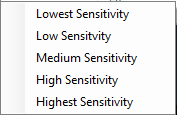
The Timer Marker Table displays a points of interest (signal differentiations) table. The points of interest displayed is dependent on the user selected sensitivity. The sensitivity levels are determined from the menu shown in Figure: Time Marker Table Menu. Click the level of sensitivity to determine the most substantial signal-time differentiation (Lowest Sensitivity) to the least substantial signal-time differentiation (Highest Sensitivity).
Time Marker Table Menu
1. Time Marker Table: Displays time marker as points of interest.
Click to display the sensitivity menu shown below. Set the Lowest Sensitivity displays the most points. Set the Highest Sensitivity displays the least points across the IQ data stream.
Import Points of Interest
Import the points of interest using the View menu’s Points of Interest Table. See Points of Interest.
Shift or Control-click particular frequencies in the list to select signals for saving as WAV files. Confirmation dialog shown below displays number of files and navigation to file location.
Save All Channels to WAV Files:
Save all frequencies to WAV files. Confirmation dialog shown below displays number of files and navigation to file location. WAV files are saved to the same folder as the data file that is being processed.