The AM/FM modulation measurement evaluates the quality of the baseband signal retrieved from the modulated signal. The graphical representation of the baseband signal indicates the pattern of modulation depth/deviation versus frequency and time.
The AM/FM audio provides quantitative measurements of analog radio transmitters using amplitude and frequency modulation. In addition to numeric results, AM/FM modulation measurement provides a new audio spectrum display and audio demodulated signal vs time (oscilloscope) display.
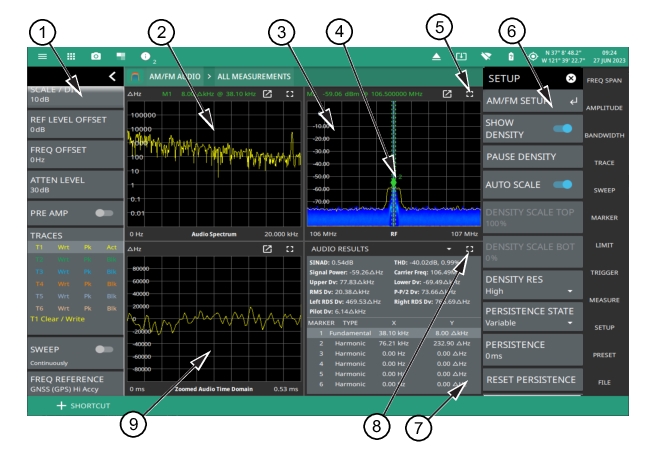
The ALL MEASUREMENTS view consists of the graphical representations of AUDIO SPECTRUM, AUDIO TIME DOMAIN, RF SPECTRUM in addition to AUDIO RESULTS table.
The audio spectrum displays the frequency spectrum of the demodulated audio signal.
The audio time domain provides an oscilloscope style display of the demodulated audio signal in amplitude versus time.
The RF spectrum display is the standard RF spectrum of the modulated carrier.
The audio results table consists of several numerical measurements such as SINAD (Signal-to-Noise and Distortion) ratio, THD (Total Harmonic Distortion), depth and deviation.
2. The audio spectrum displays the frequency spectrum of the demodulated audio signal. It displays depth (%) in amplitude modulation, and deviation (Hz) in frequency modulation.
3. The RF spectrum graph represents the minimized view of the RF spectrum view.
4. The demodulation marker is used to select the audio signal in the RF frequency domain. Toggle on DEMOD MKR button to analyze the audio signal.
5. The full screen icon displays the maximized view of the selected graph with audio results table displayed at the bottom. Touch exit full screen icon to exit the full screen view. Note that when the audio results table is viewed in full screen the corresponding graphs are not displayed at the bottom of the screen.
7. The audio results displays several numerical measurements such as SINAD (Signal-to-Noise and Distortion), THD (Total Harmonic Distortion), Pilot Deviation, left/right RDS deviation, FM deviation etc. It also includes the fundamental and harmonic markers in addition to X and Y axes coordinates of the marker locations.
8. This drop-down menu allows you to switch between marker table and audio results display. Note that Marker Table is only visible when MARKER TABLE is toggled on in MARKER menu.
9. The audio time domain graph also referred as oscilloscope, represents the AM depth (%) or FM deviation (Hz) of the audio signal versus time.
AM/FM Metrics
Field Master Series and Remote Spectrum Monitor instruments automatically detect the highest power audio tone which is used as the fundamental tone for the audio signal in Signal-to-noise and distortion (SINAD) measurement, therefore it is not required to define the frequency of the fundamental tone. SINAD is the ratio of the total channel power relative to the unwanted signal power. Higher the value of SINAD, the better the quality of the audio signal.
SINAD ratio measures AM/FM modulation distortion. It is calculated as the ratio of the channel power relative to the power of the fundamental tone using a notch filter.
SINAD ratio (dB) is expressed in logarithmic term as follows:
Where, S = Signal Power, D = Distortion, N = Noise.
Distortion is defined as all signals in the demodulation bandwidth other than the wanted tone used to modulate the transmitter under test, including spurious and sidebands created by non linearity in the transmitter modulator.
Total harmonic distortion (THD) measurement extracts the total harmonic distortion component from the noise component in the total unwanted signal. The isolated distortion component is useful to troubleshoot the root causes of the modulation distortion.
Where, Vn = RMS value of the nth harmonic voltage, n = 10, V1 = RMS value of the fundamental component.
Note
Total harmonic distortion is calculated based on maximum of 10 harmonics. For the selected AM/FM modulation mode, the frequency of harmonics beyond the bandwidth of the audio signal is not measured.
SETUP Menu (AM/FM Audio – All Measurements)
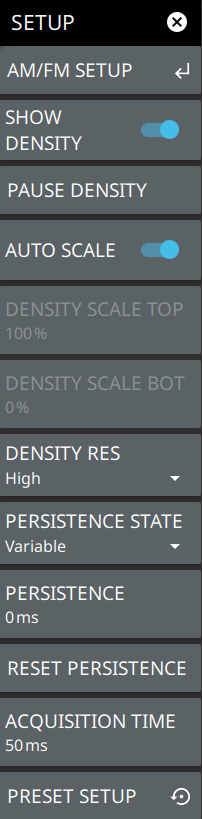
The default view of AM/FM Audio measurement is RF spectrum view. The AM/FM audio demodulation SETUP menu is available in MEASURE > MEASUREMENT > AM/FM Audio > SETUP.
Toggles the density display on or off. Density displays the relative time density of a signal in a color scale ranging from blue to red. Signals that persist longer or more often during the acquisition time are indicated in red color. Brief transient signals are shown in blue color.
PAUSE DENSITY
Pauses the display density, press RESTART DENSITY to resume displaying density.
AUTOSCALE
When toggled on, automatically adjusts the DENSITY SCALE TOP and DENSITY SCALE BOT settings of the density display based on the amplitude of the signal.
DENSITY SCALE TOP
Sets the percentage of signal time for the top (red) density scale.
DENSITY SCALE BOT
Sets the percentage of signal time for the bottom (blue) density scale. Any signal that appears at a rate lower than the DENSITY SCALE BOT setting will not appear in the density plot.
DENSITY RES
Density resolution sets the FFT size of the RTSA capture. Normal resolution sets a 512 point FFT; High resolution sets a 1024 point FFT. Higher resolution gives finer frequency detail to the density display, but increases POI. Lower resolution will result in a lower POI, but gives less frequency detail to the density display.
PERSISTENCE STATE
Toggles the persistence state between Variable or Infinite. Infinite persistence means the density plot will not fade away after a signal is no longer present. It is useful for seeing very fast and infrequent signals. Variable persistence sets a user defined time for the density colors to fade. Longer persistence values can be used to best illustrate the signals being observed.
PERSISTENCE
Sets the decay time of the density display.
RESET PERSISTENCE
Resets the decay time of the density display.
ACQUISITION TIME
The acquisition time sets the update interval for each spectrum trace, spectrogram line, and density display. During the acquisition interval, spectral data from multiple FFTs of the input signal are taken and combined. The acquisition time is adjustable to allow resolving multiple, brief signal events in time and to observe longer term behaviors.
PRESET SETUP
Presets all values on the SETUP menu to default values.
AM/FM SETUP Menu (All Measurements)
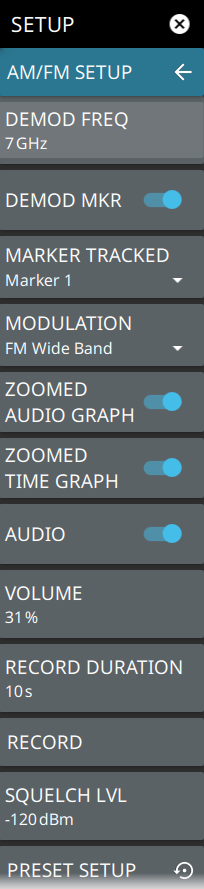
The AM/FM audio demodulation SETUP menu is available in MEASURE > MEASUREMENT > AM/FM Audio > SETUP. Make sure to select ALL MEASUREMENTS from VIEW drop-down.
AM/FM SETUP Menu (ALL MEASUREMENTS)
DEMOD FREQ
Sets the audio demodulation frequency.
DEMOD MKR
Toggles the tracked marker on and sets the demod frequency to track the marker frequency. Use the MARKER Menu to adjust the marker parameters.
MARKER TRACKED
Selects which marker to track. When DEMOD MKR is enabled, the demodulated frequency tracks the indicated marker.
MODULATION
Selects the modulation type to demodulate the RF signal. Available modulation types are AM, US Band (upper sideband), LS Band (lower sideband), FM Narrowband (6.25 12.5 and 25 kHz), and FM Wideband.
ZOOMED AUDIO GRAPH
Displays zoomed audio spectrum graph when toggled on, only available in FM modulation. Only available in Wideband FM mode. The full span audio spectrum shows 96 kHz of spectrum to include the mono audio, 19 kHz sub carrier, left and right stereo channels. The zoomed graph shows 20 kHz audio spectrum for closer analysis of the combined left/right channels.
ZOOMED TIME GRAPH
Displays zoomed audio time domain graph when toggled on. Zoomed time domain audio graph is used to view a signal modulated with an ideal sine wave to detect distortion.
AUDIO
Toggles the demodulated audio output (sound) on or off. The demodulation frequency must be within the current sweep for audio demodulation. Note that AM/FM audio demodulation cannot be used in conjunction with IQ Streaming or when the IQ streaming output port is set to Data Out.
VOLUME
Sets the percentage of audio output volume or mutes the audio.
RECORD DURATION
Sets the audio recording time. The maximum recording time is approximately 27 hours, depending on available storage.
RECORD
Starts audio recording. Recorded audio files (.wav) are saved to the Waves folder. Audio will be recorded for the recording duration or will stop when AUDIO is toggled off.
SQUELCH LVL
Sets the RF threshold level for audio playback. This is typically used with weak or intermittent signals to mute the static sound when the signal is below the squelch threshold.
PRESET SETUP
Presets all the AM/FM audio setup parameters.
Status Panel (AM/FM Audio)
The status panels and features illustrated in this section are unique to the real-time spectrum analyzer and to the selected measurement and view. Below is the AM/FM audio status panel that covers RF Spectrum and spectrogram views, in addition to audio AM/FM and interference measurements (selected via MEASURE > MEASUREMENT menu).
AM/FM Audio Status Panel with minimized Status Panel Icons
-
Pressing editable parameters opens the associated menu with a keypad that allows you to conveniently change the parameter value. These are the same settings found in the right side menus.
POI
Probability of Intercept (POI) is the minimum signal duration that the analyzer can detect at full amplitude with 100% probability.
MIN DETECT
The minimum detection is the minimum signal duration that the analyzer can detect.
VOLUME
Sets the volume level for the audio response of the measurement. Note that the system volume can affect the range of this setting. Refer to Interference Finder (Option 24).
REF LEVEL
Sets the reference level of the top graticule line. If the reference level offset is not zero, OFFSET REF LEVEL is displayed at this location.
Displays the current status of up to six traces or cursors in a quick-view summary. When the measurement view is set to RF Spectrum, trace information is displayed in this area. When the measurement view is set to Spectrogram, cursor information is displayed in this area. Cursors are only available in the RTSA measurement with the Spectrogram view selected.
The summary information includes the trace or cursor number, type, mode, and detector type. The active trace will show a highlighted background with the mode and detector type restated under the table. In Spectrogram, a reference trace (T0) will show you the settings of the trace used to fill the spectrogram. The reference trace settings are applied to all traces and cursors while in Spectrogram view. Pressing a trace or cursor in the summary panel activates the pressed trace or cursor and opens the TRACE menu. It allows you to select and set up an individual trace or cursor as desired. Refer to Setting Trace and Cursor Parameters.
SWEEP
Toggles the current sweep setting between continuously or sweep once. Refer to Setting Sweep Parameters.
FREQ REFERENCE
Indicates the current frequency reference source of Internal High Accuracy (used after GPS has lost sync, but while the internal clock still has good GPS reference), Internal Standard Accuracy, External, or GNSS (GPS) Hi Accuracy (requires GPS). The instrument automatically selects the frequency reference in the following order of priority: external, GPS, then the internal time base.