To select AM/FM modulation measurements view go to main menu and press MEASURE > MEASUREMENT > AM/FM Audio, and select ALL MEASUREMENTS from the VIEW drop-down. The AM/FM modulation measurements are set up using the SETUP Menu (AM/FM Audio – All Measurements View). The AM/FM modulation measurement evaluates the quality of the baseband signal retrieved from the modulated signal. The graphical representation of the baseband signal indicates the pattern of modulation depth/deviation versus frequency and time.
The AM/FM audio provides quantitative measurements of analog radio transmitters using amplitude and frequency modulation. In addition to numeric results, AM/FM modulation measurement provides a new audio spectrum display and audio demodulated signal vs time (oscilloscope) display.
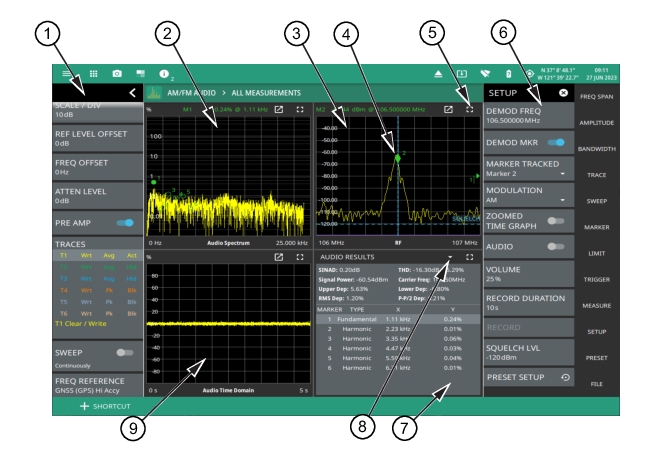
The ALL MEASUREMENTS view consists of the graphical representations of AUDIO SPECTRUM, AUDIO TIME DOMAIN, RF SPECTRUM in addition to AUDIO RESULTS table.
The audio spectrum displays the frequency spectrum of the demodulated audio signal.
The audio time domain provides an oscilloscope style display of the demodulated audio signal in amplitude versus time.
The RF spectrum display is the standard RF spectrum of the modulated carrier.
The audio results table consists of several numerical measurements such as SINAD (Signal-to-Noise and Distortion) ratio, THD (Total Harmonic Distortion), depth and deviation.
To select All Measurements view navigate to MEASURE>MEASUREMENT>AM/FM AUDIO>VIEW>ALL MEASUREMENTS.
AM/FM Audio – All Measurements View
1. The status panel provides quick access to common spectrum analyzer settings. See STATUS PANEL (AM/FM Audio).
2. The audio spectrum displays the frequency spectrum of the demodulated audio signal. It displays depth (%) in amplitude modulation, and deviation (Hz) in frequency modulation.
3. The RF spectrum graph represents the minimized view of the RF spectrum view.
4. The demodulation marker is used to select the audio signal in the RF frequency domain. Toggle on DEMOD MKR button to analyze the audio signal.
5. The full screen icon displays the maximized view of the selected graph with audio results table displayed at the bottom. Touch exit full screen icon to exit the full screen view. Note that when the audio results table is viewed in full screen the corresponding graphs are not displayed at the bottom of the screen.
7. The audio results displays several numerical measurements such as SINAD (Signal-to-Noise and Distortion Ratio), THD (Total Harmonic Distortion), Upper/Lower AM depth etc. It also includes the fundamental and harmonic markers in addition to X and Y axes coordinates of the marker locations.
8. This drop-down menu allows you to switch between marker table and audio results display. Note that Marker Table is only visible when MARKER TABLE is toggled on in MARKER menu.
9. The audio time domain graph also referred as oscilloscope, represents the AM depth (%) or FM deviation (Hz) of the audio signal versus time.
AM/FM Metrics
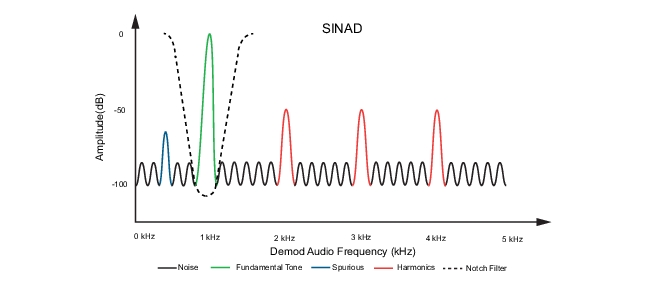
Field Master Series and Remote Spectrum Monitor instruments automatically detect the highest power audio tone which is used as the fundamental tone for the audio signal in Signal-to-noise and distortion (SINAD) measurement, therefore it is not required to define the frequency of the fundamental tone. SINAD is the ratio of the total channel power relative to the unwanted signal power. Higher the value of SINAD, the better the quality of the audio signal.
SINAD ratio measures AM/FM modulation distortion. It is calculated as the ratio of the channel power relative to the power of the fundamental tone using a notch filter.
SINAD ratio (dB) is expressed in logarithmic term as follows:
Where, S = Signal Power, D = Distortion, N = Noise.
Distortion is defined as all signals in the demodulation bandwidth other than the wanted tone used to modulate the transmitter under test, including spurious and sidebands created by non linearity in the transmitter modulator. Refer to the graphical representation of SINAD measurement as shown in Figure: SINAD Measurement.
SINAD Measurement
Total harmonic distortion (THD) measurement extracts the total harmonic distortion component from the noise component in the total unwanted signal. The isolated distortion component is useful to troubleshoot the root causes of the modulation distortion.
Where, Vn = RMS value of the nth harmonic voltage, n = 10, V1 = RMS value of the fundamental component.
Note
Total harmonic distortion is calculated based on maximum of 10 harmonics. For the selected AM/FM modulation mode, the frequency of harmonics beyond the bandwidth of the audio signal is not measured.
SETUP Menu (AM/FM Audio – All Measurements View)
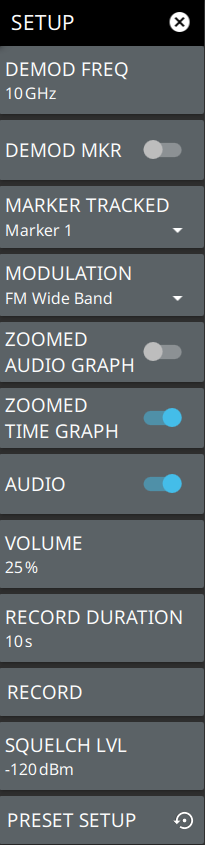
The AM/FM audio demodulation SETUP menu is available in MEASURE > MEASUREMENT > AM/FM Audio > SETUP.
SETUP Menu (AM/FM Audio – ALL MEASUREMENTS)
DEMOD FREQ
Sets the audio demodulation frequency.
DEMOD MKR
Toggles the tracked marker on and sets the demod frequency to track the marker frequency. Use the MARKER Menu to adjust the marker parameters.
MARKER TRACKED
Selects which marker to track. When DEMOD MKR is enabled, the demodulated frequency tracks the indicated marker.
MODULATION
Selects the modulation type to demodulate the RF signal. Available modulation types are AM, US Band (upper sideband), LS Band (lower sideband), FM Narrowband (6.25 12.5 and 25 kHz), and FM Wideband.
ZOOMED AUDIO GRAPH
Displays zoomed audio spectrum graph when toggled on, only available in FM modulation. Only available in Wideband FM mode. The full span Audio Spectrum shows 96 kHz of spectrum to include the mono audio, 19 kHz sub carrier, left and right stereo channels. The zoomed graph shows 20 kHz audio spectrum for closer analysis of the combined left/right channels.
ZOOMED TIME GRAPH
Displays zoomed audio time domain graph when toggled on. Zoomed time domain audio graph is used to view a signal modulated with an ideal sine wave to detect distortion.
AUDIO
Toggles the demodulated audio output (sound) on or off. The demodulation frequency must be within the current sweep for audio demodulation. Note that AM/FM audio demodulation cannot be used in conjunction with IQ Streaming or when the IQ streaming output port is set to Data Out.
VOLUME
Sets the percentage of audio output volume or mutes the audio.
RECORD DURATION
Sets the audio recording time. The maximum recording time is approximately 27 hours, depending on available storage.
RECORD
Starts audio recording. Recorded audio files (.wav) are saved to the Waves folder. Audio will be recorded for the recording duration or will stop when AUDIO is toggled off.
SQUELCH LVL
Sets the RF threshold level for audio playback. This is typically used with weak or intermittent signals to mute the static sound when the signal is below the squelch threshold.
PRESET SETUP
Presets all the AM/FM audio setup parameters.
STATUS PANEL (AM/FM Audio)
Below is the status panel with the corresponding minimized status panel icons for AM/FM audio measurement. The status panel holds good for Option 24 and Option 509.
Status Panel with Minimized Status Panel Icons (AM/FM audio)
REF LEVEL
Sets the reference level of the top graticule line in the selected units. If the reference level offset is not zero, OFFSET REF LEVEL is displayed at this location.
Displays the current status of up to six traces or cursors in a quick-view summary. When the measurement view is set to RF Spectrum, trace information is displayed in this area. When the measurement view is set to Spectrogram, cursor information is displayed in this area. Cursors are available in the Spectrum measurement with the Spectrogram view selected.
The summary information includes the trace or cursor number, type, mode, and detector type. The active trace will show a highlighted background with the mode and detector type restated under the table. In Spectrogram, a reference trace (T0) will show you the settings of the trace used to fill the spectrogram. The reference trace settings are applied to all traces and cursors while in Spectrogram view. Selecting a trace or cursor in the summary panel activates the pressed trace or cursor and opens the TRACE menu, allowing you to select and set up an individual trace or cursor as desired. Refer to Setting Trace Parameters.
SWEEP
Toggles the current sweep setting between continuously or sweep once. Refer to Setting Sweep Parameters.
FREQ REFERENCE
Indicates the current frequency reference source of Internal High Accuracy (used after GPS has lost sync, but while the internal clock still has good GPS reference), Internal Standard Accuracy, External, or GNSS (GPS) Hi Accy (requires GPS). The instrument automatically selects the frequency reference in the following order of priority: external, GPS, then the internal time base.