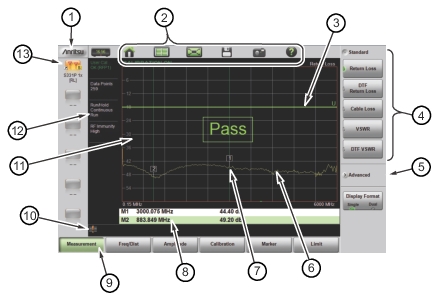
1 | Anritsu logo. Displays the System Status dialog. Press ESC orto close. Refer to the Status Menu for additional information. |
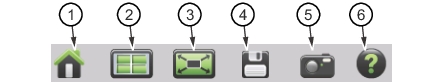
2 | System Function Tool Bar. Shortcuts to various system functions. See System Function Tool Bar for information on each icon. Not displayed in Classic Mode. |
3 | User-defined limit line. |
4 | Expanded submenu. Expanded submenus display the function buttons. |
5 | Collapsed submenu. Pressing a collapsed submenu title will cause it to expand as shown in row 4. Refer to Submenu Keys. |
6 | Active trace sweeping between Start Frequency (F1) and Stop Frequency (F2). |
7 | Marker 1. |
8 | Marker table. Refer to Markers. |
9 | Main menu keys with Measurement selected. Refer to Main Menu Keys. |
10 | Warning and status area. |
11 | Trace window (or graticule), a 10 x 10 grid showing the active trace. |
12 | Measurement information. Displays current status. May also be used as a shortcut to submenus. |
13 | User-defined shortcuts. Not available in Classic Mode. |
Key Description | Key Example |
---|---|
1. Numeric Entry example: Start Frequency (F1) key in the Freq/Dist menu. Opens an edit box where you can enter a value using the numeric keypad (see Figure: Entering Frequency Setting). Press one of the unit keys to apply the value or press ESC to cancel the entry. Press 
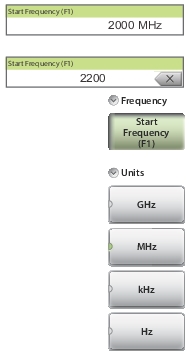
to delete the last digit entered. Entering a value beyond the range of the instrument will set the parameter to the maximum or minimum value. | |
2. Toggle Each press of the button cycles between the available settings. The active setting is indicated by the green indicator. | |
3. Menu Selection example: Measurement main menu. This key type is used when multiple options are available. The current choice is indicated by the green indicator at the left of the button. | |
4. Submenu Selection example: Data Points key in the Sweep (3) menu. The current setting is displayed below the key label. Pressing the key opens a submenu of available choices. Press one of the keys to select a new value. Press ESC to exit the submenu without making a change. | |
5. Dialog Dialog buttons are indicated with 3 green dots in the lower-right corner of the key. Pressing this key type will display a list or dialog box. Press ESC to close the dialog or list box. | |
6. Action Pressing an action key triggers the associated function. |
1 | Preset icon – Opens the Preset (9) Menu. See Preset Menu for additional information. |
2 | Mode Selector icon – Opens the Mode Selector window, where you can switch between Advanced and Classic Cable-Antenna Analyzer mode. Tap an icon (Figure: Mode Selector Window) to change modes or press ESC to cancel. |
3 | Full Screen icon – Sets the display to full screen mode (hides all of the tool bars, shortcut icons, and menus). Full screen view increases the size of the trace window. Press ESC to return to normal view. Measurement menus are not accessible in Full screen mode, but the AutoScl (.), Run/Hold (+/-), Save (7), and ScrnShot (4) keys are active. Displayed markers can also be moved using the touch screen on your tablet. Refer to Figure: Comparison of Standard Mode vs. Full Screen Mode for a comparison of the two views. |
4 | Save icon – Shortcut to open the Save dialog. See Save File for additional information. |
5 | Camera icon – Captures a screen shot of the current interface display and saves it as a PNG file to the default location on your tablet or PC. The file is named based on the instrument model, measurement type, and current date and time. The ScrnShot (4) key performs the same function. Refer to Screen Shot Capture for examples and details on the image capture options (capture size, background color, and header/footer). |
6 | Help icon – Shortcut to access the Help (0) feature. See Help for more information. |